---
title: "Subacute Cerebral Infarction"
docid: "0109f4c0-c84a-4d85-97cb-afe437b9cc43"
authors:
- key: "8d5254e9-8dda-478b-8f08-bdee97a32c79"
value: "Karen L. Salzman, MD, FACR"
breadcrumbs:
-
name: "Brain"
slug: "brain"
treeNodeId: "6d8829f1-14d7-45af-8675-255189aa526a"
-
name: "Diagnosis"
slug: "diagnosis"
treeNodeId: "51c00394-446e-4a38-94af-d3b1d14d34e8"
-
name: "Pathology-Based Diagnoses"
slug: "pathology-based-diagnoses"
treeNodeId: "d9d3a8ed-f21b-4831-8c77-591a3500ef77"
-
name: "Stroke"
slug: "stroke"
treeNodeId: "12307683-f1ff-4823-a7d3-b10b40f9fd82"
-
name: "Cerebral Ischemia and Infarction"
slug: "cerebral-ischemia-and-infarction"
treeNodeId: "51051846-a223-42f7-b626-2a5a26cf6c44"
-
name: "Subacute Cerebral Infarction"
slug: "subacute-cerebral-infarction"
treeNodeId: null
category: "Brain"
cmeTopicId: "56146806-ca6e-440e-a0cf-9c7a446b1906"
documentVersionId: "3dccb47d-0565-41ae-855b-a166b848e50f"
imageCount: 28
lastUpdated: "08/10/20"
pageDescription: "Subacute Cerebral Infarction"
pageKeywords: "Brain, Diagnosis, Pathology-Based Diagnoses, Stroke, Cerebral Ischemia and Infarction, Subacute Cerebral Infarction"
pageTitle: "Subacute Cerebral Infarction | STATdx"
enhancedTitle: "Subacute Cerebral Infarction"
type: "DX"
references: true
breadcrumbs:
- "Brain"
- "Diagnosis"
- "Pathology-Based Diagnoses"
- "Stroke"
- "Cerebral Ischemia and Infarction"
- "Subacute Cerebral Infarction"
---
# KEY FACTS
- ## Terminology
- Subacute infarction ~ 2-14 days following initial ischemic event
- ## Imaging
- Best diagnostic clue: Gyral edema and enhancement within basal ganglia and cortex
- Typically wedge-shaped abnormality involving gray and white matter within vascular distribution
- Hemorrhagic transformation of initial ischemic infarction occurs in 20-25% of middle cerebral artery (MCA) occlusions, usually by 48-72 hours
- "2-2-2" rule = enhancement begins at 2 days, peaks at 2 weeks, disappears by 2 months
- MRS: ↑ lactate, ↓ NAA within infarcted tissue
- DWI: ↑ diffusion restriction, ↓ ADC initially, reversing as it proceeds into/through subacute stage
- "Fogging" effect = normal T2WI with striking enhancement on T1WI C+ 1-2 weeks following ictus
- ## Top Differential Diagnoses
- Neoplasm
- Venous infarction
- Encephalitis/cerebritis
- ## Clinical Issues
- Acute-onset focal neurologic deficit
- Elderly patient with typical risk factors: Hypertension, diabetes, smoking history, obesity, hypercholesterolemia
- 1st month after infarction, mortality predominantly from neurologic complications; 1:4 die of recurrent stroke event
- Acute anticoagulation after 1st infarction reduces mortality
- ## Diagnostic Checklist
- Enhancement is key to defining subacute stage of cerebral infarction
- Subacute ischemia often mimics neoplasm
- Recommend short-term follow-up to ensure expected course of evolution
# TERMINOLOGY
- ## Abbreviations
- Subacute stroke, subacute cerebrovascular accident (CVA)
- ## Definitions
- Focal brain necrosis following obstruction of blood flow to localized area of brain
- Subacute infarct ~ 2-14 days following initial ischemic event
- May occur ± hemorrhagic transformation (HT)
# IMAGING
- ## General Features
- ### Best diagnostic clue
- Gyral edema, enhancement in basal ganglia/cortex
- Look for HT
- Typically occurs in 20-25% of cases 2-7 days after acute event
- Related to reperfusion, spontaneous or following therapy
- ### Location
- Cerebral hemispheres, brainstem, cerebellum in territorial vascular distribution
- ### Size
- Extremely variable
- Ranges from focal ("lacunes") to global (hemispheric)
- ### Morphology
- Variable depending on location, size, etiology
- Typically wedge-shaped; involves both gray and white matter
- Recognizable vascular distribution
- ## CT Findings
- ### NECT
- Wedge-shaped area of ↓ attenuation involving gray and white matter
- Mass effect initially ↑, then ↓ by 7-10 days; often less than expected given lesion size as acuity resolves
- HT of ischemic infarct occurs in 20-25% of middle cerebral artery (MCA) occlusions, usually by 48-72 hours
- Common locations are basal ganglia and cortex
- Hemorrhagic foci detected in majority of medium/large subacute infarcts
- ### CECT
- Enhancement typically patchy or gyral
- May appear as early as 2-3 days after ictus; persists up to 8-10 weeks
- "2-2-2" rule = enhancement begins at 2 days, peaks at 2 weeks, disappears by 2 months
- ### CTA
- Evidence of subacute occlusion correlates strongly, independently with poor clinical outcome
- Significantly worse discharge National Institutes of Health Stroke Scale (NIHSS) score
- CT perfusion
- More useful in acute > subacute stroke
- Helpful in predicting tissue outcome
- Significant difference between infarct and periinfarct tissue for both relative cerebral blood flow (rCBF), relative cerebral blood volume (rCBV)
- ## MR Findings
- ### T1WI
- Hypointense edema with mass effect
- HT: Signal changes of hemorrhage
- May see gyriform ↑ signal (pseudolaminar necrosis)
- ### T2WI
- Hyperintense edema with mass effect
- "Fogging" effect = normal T2WI with striking enhancement on T1WI C+ 1-2 weeks following ictus
- HT: Signal changes of evolving hemorrhage
- Early wallerian degeneration can occur
- Look for well-defined hyperintense band in corticospinal tract
- ### FLAIR
- Hyperintense edema with mass effect
- Hyperintensity (dot sign) in slow-flowing/occluded vessels
- By 1 week, final infarct volume corresponds to FLAIR-defined abnormality
- May see "fogging" effect, similar to T2WI
- ### T2* GRE
- May see blooming if HT has occurred
- ### DWI
- ↑ diffusion restriction, ↓ ADC initially, reversing as it proceeds into/through subacute stage
- DWI, T1WI C+ complement each other in detecting subacute infarcts
- Early subacute can be ↑ DWI and ↓ T1WI C+
- ### T1WI C+
- Intravascular enhancement in initial 48 hours; disappears at 3-4 days as vessels recanalize
- Parenchymal enhancement (typically patchy or gyral)
- May appear as early as 2-3 days after ictus
- Can persist up to 8-10 weeks
- ### MRA
- Vessel occlusion (large vessel)
- ### MRS
- ↑ lactate, ↓ NAA within infarcted tissue
- In subacute and chronic infarction, lactate/choline and NAA/choline ratios correlate with outcome
- Positive correlation between NAA and Scandinavian Stroke Scale (SSS) scores
- Positive correlation between NAA reduction and Barthel index scores
- Lactate presence correlates with lower SSS scores
- MR T2* perfusion
- ↓ rCBV of acute infarct ↑ in subacute stage, reflecting reperfusion hyperemia
- ↓ again in chronic stage
- SWI: May see hypointensity related to microhemorrhage
- ## Angiographic Findings
- Conventional
- May see intraluminal thrombus &/or vessel occlusion
- Slow antegrade flow with delayed arterial emptying
- Slow retrograde filling through collateral vessels
- "Bare" areas = regions of nonperfused or slowly perfused brain tissue
- ## Nuclear Medicine Findings
- Diminished/absence of perfusion with SPECT or PET
- HMPAO SPECT may show reflow hyperemia after reperfusion in acute and subacute stages
- ## Imaging Recommendations
- ### Best imaging tool
- MR with DWI, T2*, T1WI C+
- Consider CT or MR perfusion (more helpful in acute stroke)
- ### Protocol advice
- CT and MR: C+ for assessing subacute age
# DIFFERENTIAL DIAGNOSIS
- [Neoplasm](/document/glioblastoma/45c3147e-3a1b-4fbf-a626-ed6e99a02ac2)
- DWI: Vasogenic ("tumoral") edema instead of cytotoxic edema
- Enhancing mass instead of patchy, gyral enhancement
- Will not regress on follow-up imaging
- [Venous Infarction](/document/cortical-venous-thrombosis/d314f5f7-21b6-46d1-a51c-e796cacc012c)
- Nonarterial distribution
- Venous instead of arterial occlusion, typically major dural sinus
- More commonly hemorrhagic, primarily affecting white matter instead of cortex
- Different clinical presentation/setting (trauma, hypercoagulable states, pregnancy, dehydration)
- [Encephalitis/Cerebritis](/document/abscess/552b58e6-aa5e-49b4-b9aa-e0413c07bf3c)
- DWI: Strong restriction
- Nonvascular distribution
- Gyriform, ring-enhancing patterns (late cerebritis)
- Different clinical presentation
# PATHOLOGY
- ## General Features
- ### Etiology
- Prolonged cerebral ischemia
- Duration and severity of ischemic insult determines cellular viability
- Less commonly, may be result of infectious etiologies
- Sequelae of meningitis (bacterial, mycobacterial, etc.)
- May also be result of inflammatory diseases, such as vasculopathy, angiitis, etc.
- Uncontrolled, unilateral, supratentorial expanding lesions can cause descending tentorial herniation → ischemic infarction of occipital lobe
- Ischemia/infarction involves typical vascular territories or watershed (border zone) distributions depending on etiology
- Sequelae of infarction vary with sensitivity of individual cell types to ischemia
- Other factors: Adequacy of collateral blood supply, degree, duration, and distribution of flow reduction
- ### Genetics
- Hypercholesterolemia, diabetes, hypertension, and homocysteine ↑ stroke risk
- ## Gross Pathologic & Surgical Features
- Blurring of gray-white demarcation
- Mass effect with narrowing of sulci, displacement of adjacent structures
- Softening of ischemic tissues from water retention
- ## Microscopic Features
- Fragmentation of axons and early disintegration of myelin sheaths; loss of oligodendrocytes, astrocytes
- 48 hours: Neutrophils begin to pass through vessel walls into brain tissue
- 72-96 hours: Macrophages aggregate around vessels
- 2 weeks: Macrophages are predominate reactive cells
# CLINICAL ISSUES
- ## Presentation
- ### Most common signs/symptoms
- Acute-onset focal neurologic deficit
- ~ 50% of patients with infarction → permanent neurologic deficits have preceding TIAs
- ### Clinical profile
- Elderly patient with typical risk factors: Hypertension, diabetes, smoking history, obesity, hypercholesterolemia, etc.
- ## Demographics
- ### Age
- Usually > 55 years
- Women often slightly older than men at presentation
- ### Sex
- Females often more disabled after age adjustment
- Fatality rates similar
- ### Epidemiology
- Highest cause of USA adult morbidity
- 3rd cause of USA adult mortality
- ## Natural History & Prognosis
- 1st month after infarction, mortality predominantly from neurologic complications
- 1:4 die of recurrent stroke event
- Later mortality from respiratory, cardiovascular causes
- Survival after 1st infarction: 1 week (92%), 30 days (83%), 6 months (77%), 1 year (71%), 5 years (46%), 10 years (28%)
- ## Treatment
- To improve long-term survival, aggressive management of pulmonary and cardiac disease is critical
- Acute anticoagulation after 1st infarction reduces mortality
- Current research: Therapeutic hypothermia and gene therapy (antiapoptotic protein BCL-2) during acute stroke event
# DIAGNOSTIC CHECKLIST
- ## Consider
- Is affected area another space-occupying pathology (i.e., tumor)?
- Recommend short-term follow-up to ensure expected course of evolution
- ## Image Interpretation Pearls
- Enhancement is key to defining subacute stage of cerebral infarction
- Appearance on DWI/ADC often helpful
62b91377-75c2-40c0-8e3d-3e9ff4f24cbd
## References
# Selected References
1. [Mistry EA et al: White matter disease and outcomes of mechanical thrombectomy for acute ischemic stroke. AJNR Am J Neuroradiol. 41(4):639-44, 2020](http://www.ncbi.nlm.nih.gov/pubmed/?term=32165366%5Bpmid%5D)
1. [Wessell AP et al: A critical assessment of the golden hour and the impact of procedural timing in stroke thrombectomy. AJNR Am J Neuroradiol. 41(5):822-7, 2020](http://www.ncbi.nlm.nih.gov/pubmed/?term=32414902%5Bpmid%5D)
1. [Bill O et al: Focal hypoperfusion in acute ischemic stroke perfusion CT: clinical and radiologic predictors and accuracy for infarct prediction. AJNR Am J Neuroradiol. 40(3):483-9, 2019](http://www.ncbi.nlm.nih.gov/pubmed/?term=30792249%5Bpmid%5D)
1. [Majidi S et al: MRI-based thrombolytic therapy in patients with acute ischemic stroke presenting with a low NIHSS. Neurology. 93(16):e1507-13, 2019](http://www.ncbi.nlm.nih.gov/pubmed/?term=31519779%5Bpmid%5D)
1. [Sotoudeh H et al: Misleading CT perfusion in subacute ischemic stroke. Emerg Radiol. 26(5):581-6, 2019](http://www.ncbi.nlm.nih.gov/pubmed/?term=31432350%5Bpmid%5D)
1. [Arnold Fiebelkorn C et al: Frequency of acute and subacute infarcts in a population-based study. Mayo Clin Proc. 93(3):300-6, 2018](http://www.ncbi.nlm.nih.gov/pubmed/?term=29426582%5Bpmid%5D)
1. [Yang YM et al: Normalization of T2 relaxation time and apparent diffusion coefficient in relation to the inflammatory changes in the substantia nigra of rats with focal cerebral ischemia. Acta Radiol. 56(7):837-43, 2015](http://www.ncbi.nlm.nih.gov/pubmed/?term=25260416%5Bpmid%5D)
1. [Zöllner JP et al: Changes of pH and energy state in subacute human ischemia assessed by multinuclear magnetic resonance spectroscopy. Stroke. 46(2):441-6, 2015](http://www.ncbi.nlm.nih.gov/pubmed/?term=25503553%5Bpmid%5D)
1. [Brunner IC et al: Plasticity and response to action observation: a longitudinal FMRI study of potential mirror neurons in patients with subacute stroke. Neurorehabil Neural Repair. 28(9):874-84, 2014](http://www.ncbi.nlm.nih.gov/pubmed/?term=24642381%5Bpmid%5D)
1. [Ntaios G et al: Acute imaging does not improve ASTRAL score's accuracy despite having a prognostic value. Int J Stroke. 9(7):926-31, 2014](http://www.ncbi.nlm.nih.gov/pubmed/?term=24894405%5Bpmid%5D)
1. [Qiao Y et al: Intracranial plaque enhancement in patients with cerebrovascular events on high-spatial-resolution MR images. Radiology. 271(2):534-42, 2014](http://www.ncbi.nlm.nih.gov/pubmed/?term=24475850%5Bpmid%5D)
1. [Drier A et al: Prediction of subacute infarct size in acute middle cerebral artery stroke: comparison of perfusion-weighted imaging and apparent diffusion coefficient maps. Radiology. 265(2):511-7, 2012](http://www.ncbi.nlm.nih.gov/pubmed/?term=22923715%5Bpmid%5D)
1. [Kamalian S et al: CT perfusion mean transit time maps optimally distinguish benign oligemia from true "at-risk" ischemic penumbra, but thresholds vary by postprocessing technique. AJNR Am J Neuroradiol. 33(3):545-9, 2012](http://www.ncbi.nlm.nih.gov/pubmed/?term=22194372%5Bpmid%5D)
1. [Donnan GA et al: Penumbral selection of patients for trials of acute stroke therapy. Lancet Neurol. 8(3):261-9, 2009](http://www.ncbi.nlm.nih.gov/pubmed/?term=19233036%5Bpmid%5D)
1. [Elkind MS: Outcomes after stroke: risk of recurrent ischemic stroke and other events. Am J Med. 122(4 Suppl 2):S7-13, 2009](http://www.ncbi.nlm.nih.gov/pubmed/?term=19332241%5Bpmid%5D)
1. [Olivot JM et al: Perfusion MRI (Tmax and MTT) correlation with xenon CT cerebral blood flow in stroke patients. Neurology. 72(13):1140-5, 2009](http://www.ncbi.nlm.nih.gov/pubmed/?term=19332690%5Bpmid%5D)
1. [Muñoz Maniega S et al: Changes in NAA and lactate following ischemic stroke: a serial MR spectroscopic imaging study. Neurology. 71(24):1993-9, 2008](http://www.ncbi.nlm.nih.gov/pubmed/?term=19064881%5Bpmid%5D)
1. [Vernino S et al: Cause-specific mortality after first cerebral infarction: a population-based study. Stroke. 34(8):1828-32, 2003](http://www.ncbi.nlm.nih.gov/pubmed/?term=12855836%5Bpmid%5D)
## Images
### Selected Images
 involving both the gray and white matter in the MCA distribution with blood products
  in the right basal ganglia.](images/app.statdx.com_image_thumbnail_d27f250c-3367-425e-9138-93a6082c618d_annotated_true_size_900_quality_90_38d5a718da65cae350d5c76f66e43e8cf888c2f7.jpg)
*Axial CT at 3 days after initial onset of weakness and speech difficulties shows the classic appearance of an early subacute cerebral infarct. Note the wedge-shaped, low-density area involving both the gray and white matter in the MCA distribution with blood products in the right basal ganglia.*
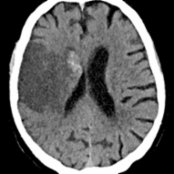
*Axial CT at 3 days after initial onset of weakness and speech difficulties shows the classic appearance of an early subacute cerebral infarct. Note the wedge-shaped, low-density area involving both the gray and white matter in the MCA distribution with blood products in the right basal ganglia.*

*Axial CT at 3 days after initial onset of weakness and speech difficulties shows the classic appearance of an early subacute cerebral infarct. Note the wedge-shaped, low-density area involving both the gray and white matter in the MCA distribution with blood products in the right basal ganglia.*

*Axial CT at 3 days after initial onset of weakness and speech difficulties shows the classic appearance of an early subacute cerebral infarct. Note the wedge-shaped, low-density area involving both the gray and white matter in the MCA distribution with blood products in the right basal ganglia.*
 in a PCA distribution.](images/app.statdx.com_image_thumbnail_e3dea8a5-436f-4b1a-a1be-3d4d434c90e7_annotated_true_size_900_quality_90_b7d1b33ad35de7ea0c06cdf2c9c179b8315084f4.jpg)
*Axial FLAIR MR in a 58-year-old man 1 week after onset of visual changes shows classic imaging of a subacute infarct with hyperintensity in the cortex and subcortical white matter of the occipital lobe in a PCA distribution.*

*Axial DWI MR in the same patient shows hyperintensity within the left PCA distribution. The hyperintensity represents a combination of true diffusion restriction and T2 shine-through.*

*Axial T1 C+ MR in the same patient shows gyriform enhancement along the cortex of the occipital lobe . This enhancement may be seen as early as 2 days and may last up to 2 months after the patient's initial ischemic event. Without clinical history, imaging may mimic a tumor, venous infarct, or cerebritis.*

*Axial FLAIR MR in a 58-year-old man 1 week after onset of visual changes shows classic imaging of a subacute infarct with hyperintensity in the cortex and subcortical white matter of the occipital lobe in a PCA distribution.*

*Axial DWI MR in the same patient shows hyperintensity within the left PCA distribution. The hyperintensity represents a combination of true diffusion restriction and T2 shine-through.*

*Axial T1 C+ MR in the same patient shows gyriform enhancement along the cortex of the occipital lobe . This enhancement may be seen as early as 2 days and may last up to 2 months after the patient's initial ischemic event. Without clinical history, imaging may mimic a tumor, venous infarct, or cerebritis.*
 in the PCA distribution in a subacute infarct patient who was sent to a neurosurgeon for concerns of a cortical "tumor."](images/app.statdx.com_image_thumbnail_3042776d-2141-413a-9339-789270323c61_annotated_true_size_900_quality_90_058151c0cf98012f420cb3179f5bbdd77df6d584.jpg)
*Axial T1 C+ MR shows well-defined gyriform enhancement in the PCA distribution in a subacute infarct patient who was sent to a neurosurgeon for concerns of a cortical "tumor."*
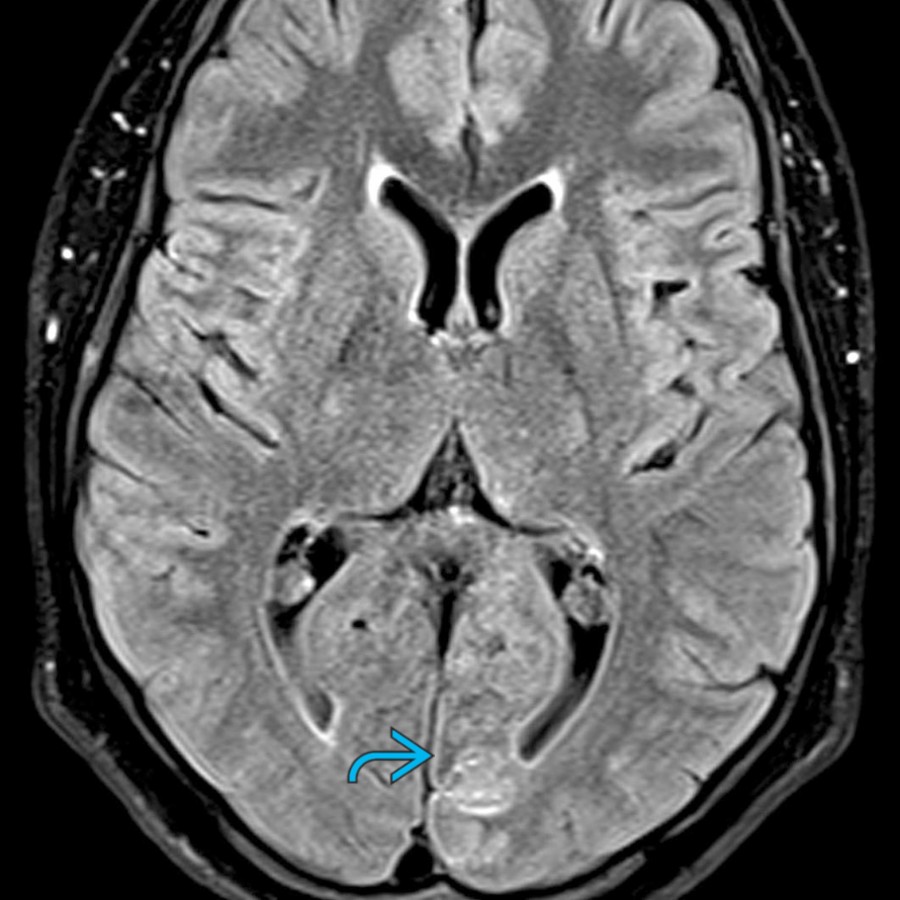
*Axial FLAIR MR in the same patient shows the "fogging" effect with near-normal signal on T2/FLAIR MR with striking enhancement on T1WI C+ MR. This "fogging" effect typically occurs 1-2 weeks following the acute stroke. Initially, the infarct shows hyperintensity, which decreases over time, with isointensity at 1-2 weeks.*

*Axial DWI MR in a 45-year-old woman with an abnormal cardiac valve resulting in embolic disease in multiple vascular distributions 5 days after a posterior circulation infarct shows high signal due to restricted diffusion in bilateral cerebellar hemispheres. DWI scans can be hyperintense up to 7-10 days following acute stroke onset.*

*Axial T1 C+ MR in the same patient shows patchy enhancement in the right cerebellar hemisphere . Cardioembolic disease represents 15-25% of major strokes.*

*Axial DWI trace MR in a 61-year-old patient 3 days after symptoms shows DWI restriction. True restricted diffusion persists several days after stroke onset and gradually reverses with DWI hypointensity and ADC hyperintensity.*

*Axial T1 C+ MR shows gyriform enhancement in the MCA distribution. Note lack of mass effect in this late subacute infarct. The major differential considerations for a subacute infarct include neoplasm and cerebritis. Repeat imaging may be necessary to exclude neoplasm.*
### Additional Images

*Axial T1 C+ MR in the same patient shows striking curvilinear enhancement within the sulci and over the gyri of the affected area . This represents collateral flow in small vessels over and within the pia ("leptomeningeal collaterals"), adjacent to the infarcted brain.*

*Axial DWI MR demonstrates diffusion restriction in the right PCA distribution.*
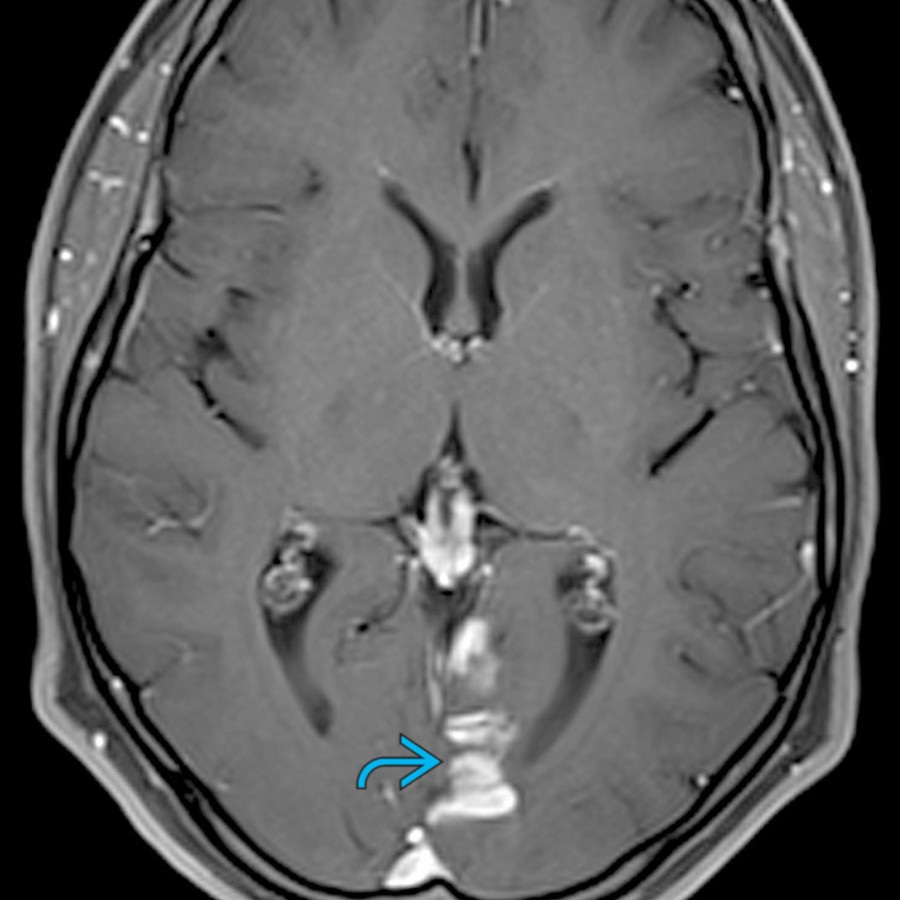
*Axial T1 C+ MR shows well-defined gyriform enhancement in the PCA distribution in a subacute infarct patient who was sent to a neurosurgeon for concerns of a cortical "tumor."*

*Axial FLAIR MR in the same patient shows the "fogging" effect with near-normal signal on T2/FLAIR MR with striking enhancement on T1WI C+ MR. This "fogging" effect typically occurs 1-2 weeks following the acute stroke. Initially, the infarct shows hyperintensity, which decreases over time, with isointensity at 1-2 weeks.*

*Axial DWI MR in a 45-year-old woman with an abnormal cardiac valve resulting in embolic disease in multiple vascular distributions 5 days after a posterior circulation infarct shows high signal due to restricted diffusion in bilateral cerebellar hemispheres. DWI scans can be hyperintense up to 7-10 days following acute stroke onset.*

*Axial T1 C+ MR in the same patient shows patchy enhancement in the right cerebellar hemisphere . Cardioembolic disease represents 15-25% of major strokes.*

*Axial DWI trace MR in a 61-year-old patient 3 days after symptoms shows DWI restriction. True restricted diffusion persists several days after stroke onset and gradually reverses with DWI hypointensity and ADC hyperintensity.*

*Axial T1 C+ MR shows gyriform enhancement in the MCA distribution. Note lack of mass effect in this late subacute infarct. The major differential considerations for a subacute infarct include neoplasm and cerebritis. Repeat imaging may be necessary to exclude neoplasm.*
### Additional Images

*Axial T1 C+ MR in the same patient shows striking curvilinear enhancement within the sulci and over the gyri of the affected area . This represents collateral flow in small vessels over and within the pia ("leptomeningeal collaterals"), adjacent to the infarcted brain.*

*Axial DWI MR demonstrates diffusion restriction in the right PCA distribution.*
 , findings typical for subacute cerebral infarction.](557c8d6f-9e14-4629-8ef8-03099384bc66)
*Axial T1 MR shows swollen gyri in the left PCA distribution , findings typical for subacute cerebral infarction.*

*Axial T2 MR shows gyral swelling and extensive hyperintensity involving both the gray and white matter of the right temporal lobe.*

*Axial T1 C+ MR demonstrates classic gyriform enhancement of a subacute cerebral infarction. Some underlying T1-hyperintense hemorrhage is masked by extensive enhancement.*

*Axial NECT shows a wedge-shaped, nonhemorrhagic infarct. Lack of mass effect and CSF-like hypodensity aid in diagnosing subacute age.*

*Axial DWI MR demonstrates hyperintense restricted diffusion of cytotoxic edema within both the right ACA and MCA vascular territories.*

*Axial NECT shows a classic nonhemorrhagic left MCA territory infarction involving the basal ganglia. Note the relatively mild ventricular and sulcal mass effect given the size of the lesion during subacute stage.*

*Axial T1 MR shows a hemorrhagic subacute infarction involving gray matter as well as a small portion of subcortical white matter. Gyriform enhancement was also present.*

*Axial CECT demonstrates extensive gyral subacute infarct enhancement 6 weeks after ictus. Note the absence of mass effect given the lesion size as acuity diminishes.*

*Axial NECT demonstrates cortical hemorrhage of a subacute left MCA distribution infarction. Note the lack of mass effect given the lesion size.*

*Axial T1 MR shows swollen gyri in the left PCA distribution , findings typical for subacute cerebral infarction.*

*Axial T2 MR shows gyral swelling and extensive hyperintensity involving both the gray and white matter of the right temporal lobe.*

*Axial T1 C+ MR demonstrates classic gyriform enhancement of a subacute cerebral infarction. Some underlying T1-hyperintense hemorrhage is masked by extensive enhancement.*

*Axial NECT shows a wedge-shaped, nonhemorrhagic infarct. Lack of mass effect and CSF-like hypodensity aid in diagnosing subacute age.*

*Axial DWI MR demonstrates hyperintense restricted diffusion of cytotoxic edema within both the right ACA and MCA vascular territories.*

*Axial NECT shows a classic nonhemorrhagic left MCA territory infarction involving the basal ganglia. Note the relatively mild ventricular and sulcal mass effect given the size of the lesion during subacute stage.*

*Axial T1 MR shows a hemorrhagic subacute infarction involving gray matter as well as a small portion of subcortical white matter. Gyriform enhancement was also present.*

*Axial CECT demonstrates extensive gyral subacute infarct enhancement 6 weeks after ictus. Note the absence of mass effect given the lesion size as acuity diminishes.*

*Axial NECT demonstrates cortical hemorrhage of a subacute left MCA distribution infarction. Note the lack of mass effect given the lesion size.*
 .](960aead8-4f98-41b5-ba43-aeec725a0fe4)
*Axial collapsed view MRA reveals the lack of flow in the right PCA .*

*Axial CECT demonstrates gyriform enhancement in the left MCA territory, a finding seen in subacute infarcts.*

*Axial T2 MR shows almost no abnormality except for minimal hyperintensity on the T2 . Occasionally, subacute cerebral infarcts may be difficult to visualize on standard MR scans because of the so-called "fogging" effect.*

*Axial T1 C+ MR in the same patient demonstrates striking gyriform enhancement .*

*Sagittal T1 C+ MR shows well-defined gyriform enhancement in the right MCA distribution. Note the lack of mass effect in this late subacute infarct. The major differential considerations for a subacute infarct include neoplasm and cerebritis. Repeat imaging may be necessary to exclude neoplasm.*

*Axial NECT demonstrates gyriform hyperdensity related to cortical hemorrhagic transformation in a right hemispheric watershed infarct. Note the surrounding low-density edema.*

*Axial CT obtained 48 hours after initial onset of weakness and speech difficulties shows the classic appearance of a late acute/early subacute cerebral infarct. Note the wedge-shaped, low-density area involving both the gray and white matter in the left MCA distribution.*
.](960aead8-4f98-41b5-ba43-aeec725a0fe4)
*Axial collapsed view MRA reveals the lack of flow in the right PCA .*

*Axial CECT demonstrates gyriform enhancement in the left MCA territory, a finding seen in subacute infarcts.*

*Axial T2 MR shows almost no abnormality except for minimal hyperintensity on the T2 . Occasionally, subacute cerebral infarcts may be difficult to visualize on standard MR scans because of the so-called "fogging" effect.*

*Axial T1 C+ MR in the same patient demonstrates striking gyriform enhancement .*

*Sagittal T1 C+ MR shows well-defined gyriform enhancement in the right MCA distribution. Note the lack of mass effect in this late subacute infarct. The major differential considerations for a subacute infarct include neoplasm and cerebritis. Repeat imaging may be necessary to exclude neoplasm.*

*Axial NECT demonstrates gyriform hyperdensity related to cortical hemorrhagic transformation in a right hemispheric watershed infarct. Note the surrounding low-density edema.*

*Axial CT obtained 48 hours after initial onset of weakness and speech difficulties shows the classic appearance of a late acute/early subacute cerebral infarct. Note the wedge-shaped, low-density area involving both the gray and white matter in the left MCA distribution.*